Number of Issues

103

Article View

1,307,040

PDF Download

852,793

View Per Article

1759.14

PDF Download Per Article

1147.77

Number of Submissions

1,511

Rejected Submissions

933

Reject Rate

62

Accepted Submissions

263

Acceptance Rate

17

Time to Accept (Days)

332

Number of Indexing Databases

16

Number of Reviewers

487

Iranian Journal of Economic Research is an open-access, double-blind, peer-reviewed journal published by Allameh Tabataba’i University, the leading university in Humanities and Social Sciences in Iran.Economic Research has been established to provide an intellectual platform for national and international researchers working on issues related to Economic Research Planning. The Journal was founded in as a response to quick advancements in Economic Research and was dedicated to the publication of highest-quality research studies that report findings on issues of great concern to the profession of Economic Development.

To allow for easy and worldwide access to the most updated research findings, the journal is set to be an open-access journal. Yet, the journal does not charge any fee for reviewing, processing, and publishing research papers from the authors or from the research institutes and organizations. All the mentioned processes for paper publication are sponsored by Allameh Tabataba’i University Press.  

The journal is published in both a print version and an online version.

All the costs will be financially supported by Allameh Tabatabai University.

Non-Iranian authors are free of mentioned charges.

Iranian Journal of Economic Researchis licensed under a Creative Commons Attribution-NonCommercial 4.0 International License            Creative Commons License

 
Research Paper International economy

Application of the Extended Hypothetical Extraction Method to the Decomposition of Value Added in Iran’s Gross Exports: Country-Level and Bilateral Perspectives

Pages 1-45

https://doi.org/10.22054/ijer.2026.91081.1453

Marjan Kordbache, Ali Aghar Banouei, Esfandiar Jahangard, Javid Bahrami

Abstract Iran’s trade pattern is asymmetric and heavily dependent on upstream industries. Converting gross trade flows into value-added terms and analyzing them at both the aggregate and sectoral levels can provide a basis for assessing Iran’s position in global value chains (GVCs). In this respect, the current study investigated the potential underestimation or overestimation of gross domestic product (GDP) resulting from the conversion of gross trade into value-added terms through the construction of a trade in value added (TiVA) satellite account. Second, the study evaluated Iran’s participation in GVCs. To quantitatively examine these issues, the study employed the Eora multi-region input-output (MRIO) database for 1990 and 2017, and applied the extended hypothetical extraction method within a comparative statics framework. The findings first indicated that the TiVA satellite account was fully consistent with the system of national accounts (SNA) and, consequently, with each country’s GDP. Second, from a country-level perspective, the shares of value-added exports (VAX) and returned domestic value added (REF) embodied in Iran’s gross exports exceeded the global average, indicating a relatively strong upstream position in GVCs. In contrast, the shares of foreign value added (FVA) and double counting (DC) remained below the global average, reflecting Iran’s limited integration into GVCs. From a bilateral perspective, the results suggested that Iran’s membership in BRICS and the Shanghai Cooperation Organization (SCO) has the potential to strengthen the country’s participation in GVCs. Introduction The decomposition of value added embodied in gross exports at both the aggregate and sectoral levels can provide a useful framework for analyzing countries’ positions within global value chains (GVCs). The primary objective of this study was to develop a comprehensive framework for decomposing Iran’s gross exports into domestic value-added exports (VAX) (distinguishing between intermediate and final goods); foreign value-added exports (FVA) (distinguishing between intermediate and final goods); returned domestic value added (REF); domestic double counting (DDC); and foreign double counting (FDC). The decomposition was conducted at both the aggregate and sectoral levels, and the results were compared with those of other countries. The study aimed to address two research questions: Do double counting and returned domestic value added lead to the overestimation or underestimation of gross domestic product? And can Iran’s membership in international economic cooperation organizations enhance the country’s participation in global value chains? Materials and Methods This study employed the extended hypothetical extraction method as the analytical framework for decomposing the value added embodied in Iran’s gross exports. The analysis relied on the UNCTAD–Eora multi-regional input–output (MRIO) database for 1990 and 2017, covering Iran and 72 other countries. From a country-level perspective, gross exports were decomposed into eight components. Moreover, from a bilateral perspective, Iran’s exports to its trading partners were decomposed into ten components. A comparative statics approach was then used to analyze the findings. Results and Discussion The decomposition of Iran’s gross exports at the aggregate level from the country-level perspective, together with the sum of the bilateral decompositions from the bilateral perspective (Table 1), yielded several important findings. First, the sum of all decomposed components was exactly equal to gross exports, demonstrating that the proposed framework ensures consistency between the TiVA satellite account and the SNA. Second, because double counting (DC) and returned domestic value added (REF) were embodied in both exports and imports, they did not result in either the overestimation or underestimation of GDP when national accounts were compiled using the expenditure approach and the production balance identity. Third, the total amount of double counting obtained from the bilateral perspective was smaller than that derived from the country-level perspective, suggesting that the country-level decomposition provides a more comprehensive measure of double counting than the bilateral decomposition. From the country-level perspective at the aggregate level, the largest share of Iran’s gross exports consisted of domestic value added embodied in intermediate goods. This asymmetric trade pattern is consistent with previous empirical studies of the Iranian economy and confirms that Iran’s export structure is heavily concentrated in intermediate inputs, including raw materials, primary commodities, and industrial components. Moreover, the relatively low shares of foreign value added and double counting indicated the Iranian economy’s limited integration into GVCs. A comparison between Iran and the other countries in the sample further revealed that Iran’s shares of VAX and REF exceeded the global average, indicating a relatively upstream position in GVCs. In contrast, the shares of FVA and DC were below the global average, reflecting the country’s limited integration into international production networks. Finally, according to the cross-country analysis, high-income economies—including most European Union member states, Singapore, the United States, the United Arab Emirates, and South Korea—exhibited substantially higher levels of DC than lower-income economies. Table 1. Comparison of Components of Iran’s Gross Exports Based on Country-Level and Bilateral Perspectives (Thousand Dollars) Decomposition of gross exports according to the country-level perspective Decomposition of gross exports according to the bilateral perspective (sum) Components 1990 2017 Components 1990 2017 Gross Export 5,537,274 125,846,896 Gross Export 5,537,274 125,846,896 DVA_FIN 1,113,768 12,878,488 DVA_FIN 1,113,768 12,878,488 DVA_INT 3,739,772 99,395,893 DVA_INT 2,870,566 55,584,511 DVA_INTrex 869,549 43,931,772 DVA_RET 9,271.8 1,051,336 DVA_RET 9,272.5 1,052,241 DDC 386 134,650 DDC 42 13,356 FVA_FIN 175,770 2,141,152 FVA_FIN 175,770 2,141,152 FVA_INT 497,006 10,060,568 FVA_INT 383,473 5,642,774 FVA_INTrex 113,578 4,432,438 FVA_RET 1,249.5 168,052 FVA_RET 1,249.6 168,167 FDC 50 16,757 FDC 5 1,997 Source: Research findings The sectoral decomposition of Iran’s gross exports across 26 economic activities revealed that the largest shares of VAX and REF were concentrated in the mining and quarrying sector and the manufacture of refined petroleum, chemical, and non-metallic mineral products sector. The highest share of FVA was observed in the manufacture of metal products sector, while the transportation services sector exhibited the highest level of DC. The decomposition of Iran’s bilateral gross exports, aggregated by regional economic cooperation blocs, indicated that the country’s membership in the Economic Cooperation Organization (ECO) had had only a limited impact on enhancing its integration into the global economy. Although trade with the European Union offers substantial potential, it declined over the study period owing to political tensions and economic sanctions. Overall, the findings suggest that Iran’s membership in BRICS—particularly through its economic ties with China, the United Arab Emirates, and India—and its participation in the Shanghai Cooperation Organization (SCO), which includes China and several of Iran’s neighboring countries, have the potential to strengthen the country’s integration into GVCs. Conclusion This study developed a framework for decomposing the value added embodied in Iran’s gross exports from both country-level and bilateral perspectives. By integrating country-level, bilateral, and sectoral analyses, the framework enables a more comprehensive assessment of Iran’s position in GVCs and offers a useful analytical tool for evaluating changes in international production over time. The approach can also be extended to other countries and applied to assess the implications of trade integration, economic cooperation, and participation in GVCs.
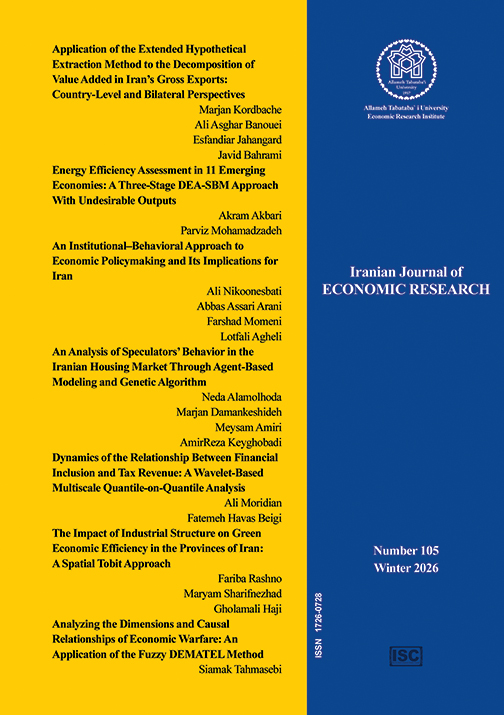
Research Paper Energy Economy

Energy Efficiency Assessment in 11 Emerging Economies: A Three-Stage DEA-SBM Approach with Undesirable Outputs

Pages 46-103

https://doi.org/10.22054/ijer.2026.92371.1474

Akram Akbari, Parviz Mohamadzadeh

Abstract This study evaluated the energy and environmental efficiency of 11 selected emerging economies using a three-stage model of data envelopment analysis–slacks-based measure (DEA-SBM) framework with undesirable outputs. Capital formation, labor, and energy consumption were used as input variables, while real gross domestic product (GDP) was treated as the desirable output and energy-related CO₂ emissions as the undesirable output. In the first stage, initial efficiency scores were estimated through a DEA-SBM model under the assumption of variable returns to scale (VRS). In the second stage, a stochastic frontier analysis (SFA) was employed to separate the effects of external environmental factors (e.g., government effectiveness, GDP per capita, urbanization, and the share of renewable energy) from managerial inefficiency and statistical noise. In the third stage, the input variables were adjusted to account for these external influences, and the efficiency scores were recalculated. The findings revealed substantial heterogeneity in energy and environmental performance across the selected countries. After adjustment, Turkey, Egypt, and Brazil achieved the highest efficiency scores, whereas Iran, Vietnam, and South Africa remained the farthest from the efficiency frontier. The results further indicated that a higher share of renewable energy was associated with lower excess energy consumption. Overall, enhancing energy–environmental performance in emerging economies requires more efficient input allocation, greater deployment of renewable energy, and policies that reduce energy intensity while supporting low-carbon economic growth. Introduction Energy efficiency has become a central issue at the intersection of economic growth, environmental sustainability, and energy security. In emerging economies, energy is a necessary input for industrialization, infrastructure expansion, urban development, and technological advancement. However, inefficient energy use increases production costs, heightens dependence on fossil fuels, and exacerbates environmental degradation through higher CO₂ emissions. Consequently, energy efficiency should not be viewed merely as a technical indicator; rather, it should be evaluated as a measure of energy–environmental performance that reflects how effectively countries transform capital, labor, and energy into desirable economic outputs while minimizing undesirable environmental outcomes. The significance of this issue is particularly pronounced in emerging economies, where policymakers face the dual challenge of sustaining economic growth while mitigating the environmental consequences of energy-intensive development. Conventional single-stage efficiency models may produce biased estimates because they fail to distinguish internal managerial inefficiency from the effects of external environmental conditions and statistical noise. This limitation is especially important, as variations in institutional quality, income levels, urbanization, and structures of renewable energy can influence observed efficiency scores independently of the actual performance of decision-making units (DMU). To address this issue, the present study employed a three-stage data envelopment analysis–slacks-based measure (DEA-SBM) framework with undesirable outputs to provide a more accurate and robust assessment of the energy–environmental efficiency of selected emerging economies. The study aimed to address three main research questions: (1) What is the initial technical efficiency of the selected emerging economies in transforming capital, labor, and energy into economic output while minimizing CO₂ emissions? (2) How do external environmental factors—specifically government effectiveness, GDP per capita, urbanization, and the share of renewable energy—affect input slacks? And (3) how do adjusted efficiency scores and country rankings change after the effects of external environmental conditions and statistical noise are removed from the initial efficiency estimates? Materials and Methods This study evaluated the energy–environmental efficiency of 11 emerging economies over the period 2000–2023. The selected emerging economies included Brazil, China, Egypt, India, Iran, Mexico, Morocco, the Philippines, South Africa, Turkey, and Vietnam. The data was obtained from the World Bank’s World Development Indicators and governance-related databases. The analysis employed a three-stage DEA-SBM model with undesirable outputs. This model was particularly suitable because it could account for input excesses and undesirable environmental outputs within a non-radial framework. In the first stage, a DEA-SBM model under the assumption of variable returns to scale (VRS) was used to estimate the initial efficiency scores. Capital formation, labor, and energy consumption were specified as inputs, while real gross domestic product (GDP) served as the desirable output and energy-related CO₂ emissions as the undesirable output. This specification enabled the assessment of whether countries could reduce input use and undesirable emissions while maintaining or increasing desirable economic outputs. In the second stage, a stochastic frontier analysis (SFA) was applied to decompose input slacks into three components: the effects of external environmental conditions, managerial inefficiency, and statistical noise. The environmental variables included GDP per capita, government effectiveness, urbanization, and the share of renewable energy. The share of renewable energy was included only in the energy-slack equation because of its direct influence on the structure of energy consumption. In the third stage, the original input variables were adjusted based on the SFA results, and the DEA-SBM model was re-estimated to obtain efficiency scores that more accurately reflected the intrinsic energy–environmental performance of the selected economies. Results and Discussion The first-stage results revealed substantial cross-country variation in initial technical efficiency. India, Turkey, and Brazil achieved the highest average efficiency scores, indicating superior performance in transforming capital, labor, and energy into economic output while minimizing CO₂ emissions. In contrast, Iran and South Africa recorded the lowest efficiency levels, reflecting a considerable distance from the efficiency frontier. These findings suggest that the selected emerging economies exhibit marked differences in their energy–efficiency patterns, with variations in input use, energy intensity, and environmental performance playing an important role in shaping their initial efficiency rankings. The second-stage results showed that external environmental factors significantly influenced input slacks. GDP per capita had a positive and statistically significant effect on capital slack, indicating that higher income levels were not necessarily associated with more efficient capital use. Urbanization reduced both capital and labor slacks, suggesting that agglomeration economies, improved infrastructure, and more efficient labor–market matching contributed to better resource utilization. However, urbanization increased energy slack, implying that urban expansion may place additional pressure on energy systems when not accompanied by energy-efficient infrastructure and technologies. The share of renewable energy had a negative and statistically significant effect on energy slack, indicating that a cleaner energy mix was associated with lower excess energy consumption. After adjusting the input variables in the third stage, the efficiency scores and country rankings changed substantially. Turkey, Egypt, and Brazil emerged as the most efficient economies after accounting for the effects of external environmental conditions and statistical noise. Egypt’s improved ranking suggested that its initial efficiency had been partly constrained by unfavorable external conditions. By contrast, India’s decline in the adjusted ranking indicated that part of its initial performance might have reflected favorable environmental conditions rather than superior managerial efficiency. Iran, Vietnam, and South Africa remained the least efficient economies after adjustment, confirming that their poor performance could not be attributed solely to external conditions or random shocks. Instead, their persistent inefficiencies appear to stem from structural challenges, including input allocation, high energy intensity, and a limited capacity to convert energy inputs into economic output while minimizing environmental impacts. Conclusion According to the findings, ignoring undesirable outputs and external environmental conditions can lead to biased assessments of energy–environmental efficiency in emerging economies. By separating the effects of external environmental factors and statistical noise from managerial inefficiency, the three-stage DEA-SBM model provides a more accurate measure of intrinsic efficiency than conventional single-stage approaches. The results suggested that countries with relatively low efficiency should not rely solely on expanding input use or pursuing conventional growth-oriented policies. Instead, they must prioritize more efficient input allocation, reducing energy intensity, expanding the deployment of renewable energy, and strengthening institutional capacity to support efficient, low-carbon production. Overall, the findings underscore that improving energy–environmental efficiency should be regarded as a strategic policy priority for emerging economies, enhancing economic competitiveness, promoting environmental sustainability, and supporting long-term development.

Research Paper Behavioral economics

An Institutional–Behavioral Approach to Economic Policymaking and Its Implications for Iran

Pages 104-136

https://doi.org/10.22054/ijer.2025.83282.1330

Ali Nikoonesbati, Abbas Assari Arani, Farshad Momeni, Lotfali Agheli

Abstract The increasing complexity of policymaking in today’s rapidly evolving world has underscored the need for hybrid analytical models to better explain the determinants of policy success and failure. Existing research suggests that both institutional and behavioral approaches have limitations in adequately accounting for policy failure. The institutional approach, for example, does not sufficiently explain policy errors that occur within democratic systems, while the behavioral approach cannot fully account for the persistence of ineffective policies and the lack of reform despite the use of behavioral interventions such as nudges. To address these shortcomings, the current study proposed an institutional–behavioral model of policymaking that integrates insights from both approaches. The proposed framework emphasizes the interplay among institutions, heuristics, and institutional structures in shaping the success or failure of policymaking. Using a comparative analytical approach, this study examined indicators and policies in Iran’s housing and healthcare sectors. According to the results, the share of housing and healthcare expenditures in total urban household spending in Iran is nearly twice the global average, indicating significant policy failure. This failure can be attributed, first, to the mismatch between the country’s institutional structure and the requirements of a democratic governance system, which undermines the quality of policymaking. Second, policymakers exhibit cognitive biases, particularly the availability heuristic, in both the housing and healthcare sectors. Specifically, they tend to assume that using public resources and increasing supply alone will improve outcomes. In doing so, they overlook the critical role of sector-specific institutions—including the legal and regulatory framework—which substantially contributes to the failure of policies. Introduction Evidence from many countries indicates that policymakers often struggle to achieve their intended policy objectives. Although sustained economic growth is a universal policy goal, many middle-income countries have remained trapped at the same income level for decades, with some even experiencing economic decline. Similar concerns have been raised about the effectiveness of policymaking in Iran, where the limited success of public policies has led some observers to question their overall effectiveness. Numerous theoretical frameworks have been developed to explain why policymaking fails. One prominent perspective is the public choice model, which is rooted in neoclassical economic theory. Another is the policy cycle model, which conceptualizes policymaking as a sequence of stages from agenda-setting to evaluation. Despite their contributions, these approaches have been criticized for their limited ability to capture the complexity of real-world policymaking. As a result, hybrid frameworks that integrate insights from multiple theoretical traditions have gained increasing attention. Against this background, the current study aimed to propose an institutional–behavioral model and apply it to explain policymaking in Iran. Materials and Methods The present study employed a comparative analysis methodology. Comparative analysis is a systematic approach to identifying causal relationships by examining the similarities and differences among social phenomena. It is particularly well suited to investigating complex policy issues in which multiple institutional and behavioral factors interact. Owing to its ability to generate robust causal inferences, this methodology has been widely applied by the proponents of the institutionalist approach. Results and Discussion According to the institutional perspective, effective policymaking is most likely to emerge in participatory or democratic political systems, where competition among ideas, accountability, and inclusivity improve the quality of policy decisions. From this viewpoint, improving policymaking requires reforming the underlying incentive structure and strengthening participatory or democratic institutions. However, democratic systems are not immune to policy failure as they can deteriorate because of the actions of political leaders and citizens, as demonstrated by historical episodes of democratic collapse. Moreover, even well-functioning democracies may adopt ineffective policies when decision-makers rely on heuristics and cognitive biases, a phenomenon highlighted during the COVID–19 pandemic. Behavioral economics focuses on the cognitive processes that shape individual decision-making. It argues that because information processing is both costly and constrained by the limited cognitive capacity of the human mind, individuals rely on heuristics, or mental rules of thumb, when making decisions. Within this perspective, nudges are among the most widely advocated strategies for improving policymaking. However, nudges are not universally effective. Individuals may have heterogeneous or conflicting preferences, or some actors may employ counter-nudges to attract public attention or offset behavioral interventions. Even decision-makers may pursue actions that serve their own interests rather than the public good. Therefore, the hybrid model presented in Figure 1 can help to better explain the issues. Figure 1. Factors Affecting Policy Outcomes Resource: Research Results The proposed model was applied to examine policymaking in Iran’s housing and healthcare sectors. The analysis revealed several findings. First, Iran’s institutional structure differs substantially from a democratic system, which adversely affects the quality of policymaking. Second, despite having a lower household-to-housing-unit ratio than countries such as the United Kingdom, Canada, and South Korea, Iranian households devote a significantly larger share of their expenditures to housing. This suggests that policymakers have focused primarily on increasing housing supply while giving insufficient attention to complementary policies, such as rent regulation, social housing, and long-term mortgage financing. Third, healthcare expenditures account for a substantially larger share of urban household spending in Iran than in many advanced economies. The share of healthcare expenditure in total urban household expenditure in Iran was 9.1% in 2013, increasing to 10.7% in 2017 before declining to 8.7% in 2024 (Statistical Center of Iran). By comparison, the corresponding share across OECD countries was 3.3% in 2017, while it was below 3% in countries such as the United Kingdom, France, Germany, and the United States (OECD, 2019). One of the main factors contributing to this disparity is the limited attention paid by Iranian policymakers to controlling induced demand in the healthcare sector. Conclusion The present study proposed a hybrid institutional–behavioral model to explain the determinants of policy success and failure. By integrating institutional and behavioral perspectives, the model highlights the roles of institutions, heuristics, and the broader institutional structure in shaping policy outcomes, thereby enhancing the explanatory power of the model. Using a comparative analytical approach, the study applied the model to the housing and healthcare sectors in Iran. The findings showed that the shares of housing and healthcare expenditures in total urban household spending are substantially higher in Iran than in comparable countries, indicating significant policy failure. From the perspective of the proposed institutional–behavioral model, one of the principal causes of this failure is the mismatch between Iran’s institutional structure and the characteristics of a democratic system. This institutional gap limits the competition of ideas and hinders the adoption of policy innovations that have proven effective in other countries. The analysis also identified the influence of the availability heuristic in both the housing and healthcare sectors. Policymakers tend to assume that using public resources and increasing supply are sufficient to improve outcomes, while giving insufficient attention to the institutional and regulatory arrangements that govern each sector.

Research Paper Housing Economy

An Analysis of Speculators’ Behavior in the Iranian Housing Market Through Agent-Based Modeling and Genetic Algorithm

Pages 137-184

https://doi.org/10.22054/ijer.2026.86895.1379

Neda Alamolhoda, Marjan Damankeshideh, Meysam Amiri, Amir Reza Keyghobadi

Abstract Housing is both a basic necessity and a non-substitutable commodity that possesses a dual nature, functioning simultaneously as a consumption good and a durable capital asset. Relying on the agent-based modeling, the present study aimed to develop a systemic model of housing price formation that could incorporate heterogeneous agents, including consumer-buyers, investors, and real estate builders. Using quarterly data for Iran spanning the period from 1998 to 2022, the proposed model was estimated through a genetic algorithm. The results of the shock analysis indicated that speculative investor behavior played a crucial role in driving housing price dynamics and volatility. In the absence of speculative investors, housing prices would converge toward a fundamental equilibrium determined by production costs and effective demand. However, speculative behavior could generate persistent deviations from this equilibrium and even trigger explosive increases in housing prices. According to the empirical findings, the Iranian housing market exhibited a high degree of forward-looking behavior (52.16%) and bubble-like, unstable dynamics throughout the sample period. From a policy perspective, the model showed that the mortgage loan-to-price ratio was not an effective instrument for stabilizing the housing market during either boom or recession periods, a finding that is consistent with real-world market evidence. By contrast, reducing construction costs could improve market rationality, moderate the responsiveness of forward-looking investors, enhance price stability, stimulate market activity, and ultimately contribute to a more stable housing market. Introduction The housing market is one of the most significant economic sectors. Owing to its depth and extensive linkages with a wide range of industries, it generates substantial spillover effects throughout the broader economy. Furthermore, fluctuations in housing prices can significantly influence consumption and investment behavior, ultimately shaping overall economic performance. In addition to serving as a consumption good, housing is also regarded as a capital asset. Demand for housing driven by consumption needs generally follows a relatively stable and predictable pattern. In contrast, investment demand is more sensitive to market conditions and is therefore considerably more volatile. These characteristics make the analysis of the housing market particularly challenging and underscore the need for more sophisticated modeling approaches. In this respect, the present study employed an agent-based modeling grounded in behavioral economics to provide a deeper understanding of housing market dynamics and improve the prediction of market behavior. Agent-based models are well suited for analyzing and simulating housing markets because they explicitly capture the heterogeneous behavior of economic agents and the complex interactions among them. Their capacity to incorporate nonlinear interactions and behavioral heterogeneity makes them particularly effective for modeling housing market dynamics. In contrast to dynamic stochastic general equilibrium (DSGE) models, which typically rely on assumptions of rational behavior and agent homogeneity, agent-based models can capture emergent phenomena such as price fluctuations, speculative bubbles, and other complex dynamics that characterize housing markets. Accordingly, the current study employed an agent-based modeling to examine the effects of different behaviors concerning the housing demand—including consumption-driven and investment-driven demand—as well as the impact of economic policies on housing prices. Specifically, the model simulated three main types of agents in the housing market: (1) owner–occupier households, who purchase housing primarily to satisfy their housing needs; (2) investors, who seek to generate returns through housing price appreciation; and (3) developers or builders, who operate in the construction sector with the objective of maximizing profits. Each type of agent makes decisions independently based on an optimization framework, with behavior guided by its own objectives. The agent-based modeling helped examine how the heterogeneous behaviors of market agents influence housing prices and market volatility. Furthermore, the flexibility of the model enabled the simulation of a wide range of policy scenarios, allowing for a comprehensive assessment of their effects on housing market dynamics. Materials and Methods The present study used an agent-based modeling to examine the Iranian housing market. The data, obtained from the Central Bank of Iran and the Statistical Center of Iran, consisted of quarterly time-series observations spanning the period from 1998 to 2022. Python 3 and its associated libraries were used to estimate and analyze an economic model of the housing market. These tools supported both data analysis and model simulation. Moreover, initial model parameters (i.e., construction costs, financing costs, interest rates, and investors’ risk aversion) were derived from empirical data and evidence from related studies. Model estimation and calibration were conducted within a heterogeneous agent modeling (HAM) framework grounded in agent-based models, which are well suited to capturing the complex, nonlinear, and asymmetric dynamics of the housing market. Unlike representative-agent models that assume homogeneous and fully rational behavior, the proposed model views agents as operating under bounded rationality and imperfect information. Moreover, a genetic algorithm was employed to identify the optimal set of model parameters. By comparing the simulated outputs with the observed data using the standard Euclidean distance metric, the algorithm searches for the parameter combination that best reproduces the dynamics of housing prices in Iran. This computational framework provides a robust tool for analyzing market behavior and facilitates the simulation and evaluation of the effects of alternative policy interventions on housing price volatility. Results and Discussion In the analysis of systems of equations, particularly in the estimation of HAMs, model identification and convergence have consistently posed fundamental challenges because of the large number of parameters and the inherent complexity of HAM frameworks. To address these challenges, the current study simplified the system of equations by focusing on the key structural parameters, thereby enabling the estimation of a limited set of parameters. Moreover, the key structural parameters of the housing price model were selected to minimize the distance between the empirically grounded parameters and those generated by the model. Given the dynamic relationship governing housing prices, the model incorporated four principal parameters: investors’ risk characteristics , the real demand factor , forecasting intensity , and construction costs . Once these four parameters are determined, the system of equations is fully specified. The estimated parameter values, together with the intensity of speculative expectations in investment behavior, are presented in the table. Table 1. Estimated Values of Model Parameters Estimated values Model parameters 1/816059 0/431520 0/1947370 0/521691 0/2828 0/5655 Source: Research estimates To evaluate the explanatory power of the model, a correlogram of the actual and fitted (ex post) values up to the tenth lag was employed. As shown in Figure 1, the model’s explanatory power declined as the lag length increased. Nevertheless, the correlation between the predicted and actual values remained above 78% through the tenth lag and reached 97% at the first lag. Figure 1. Correlation Between Actual and Predicted Housing Prices at Different Lags Source: Research estimates Furthermore, based on the estimated values of , , and the model exhibited an unstable bubble regime, which is consistent with the observed conditions of the housing market over the period under study, ending in 2022. Moreover, the model provided a systemic framework for simulating and analyzing the effects of various policy interventions on housing price volatility. The current analysis examined several policy scenarios, including changes in construction costs and housing finance measures (e.g., reductions in down-payment requirements and the relaxation of mortgage repayment conditions). Figure 2. Effects of Changes in the Loan-to-Value (LTV) Ratio Under Rising Housing Prices Source: Research estimates The analysis of housing loans and mortgage repayment costs indicated that the effectiveness of such policies would depend on their timing. Policy measures based on the ratio of affordable mortgage repayments have limited effectiveness in controlling the housing market, particularly in countries such as Iran, where housing loans account for only a small fraction of the total cost of housing during many periods, especially in recent years. Unlike installment ratios, construction costs ( ) not only affected builders’ supply and the equilibrium price but also influenced housing prices through investors. The values and also depended on construction costs ( ). In the model, construction costs include land costs, material costs, and other related expenses, with land costs representing the largest component for builders. Accordingly, when housing prices are rising, policymakers can effectively moderate the housing market by reducing builders’ costs—for example, by providing land at lower prices. Under this scenario, lower construction costs reduce the equilibrium housing price while increasing the share of investors who follow a mean-reversion strategy, thereby improving market rationality. At the same time, they reduce the sensitivity of speculative investors. As a result, housing prices can decline and converge to a new equilibrium level. Similarly, in a declining market, reducing construction costs is a more effective policy measure because it leads to a stable new equilibrium price, thereby facilitating the market’s return to its fundamental level. This effect is illustrated in Figure 3. Figure 3. Effects of Reduced Construction Costs on the Housing Market During Periods of Rising Prices Source: Research estimates Conversely, if the housing market is excessively overheated and experiencing a price bubble, increasing construction costs is not an appropriate policy for market stabilization. In some cases, this approach may even exacerbate market conditions. Higher construction costs raise the equilibrium price and increase the sensitivity of forward-looking investors—that is, they reduce —thereby making the housing market more unstable and increasing the likelihood of bubble formation or more severe market downturns. Conclusion The model presented in this study simulated speculative behavior among investors as a key driver of housing price fluctuations, demonstrating that such behavior could significantly influence housing price dynamics. The results indicated that, in the absence of speculative investors, the equilibrium housing price is determined solely by real demand and construction costs, representing the fundamental equilibrium price. However, in the presence of speculative behavior, housing prices may persistently deviate from this benchmark and may even exhibit explosive growth. The model further showed that greater forecasting intensity among investors could lead to larger deviations from the fundamental price and increased volatility in the housing market. From a policy perspective, the model indicated that measures such as loan-to-value ratios and mortgage repayment requirements are not particularly effective tools for regulating the housing market during periods of boom or recession. Consistent with observed market data, changes in mortgage repayment ratios appear to have only limited short- and long-term effects on the housing market. In contrast, reducing construction costs can significantly decrease the sensitivity of speculative investors and enhance market rationality. Such measures help stabilize the fundamental housing price and support the recovery of the housing market.

Research Paper Financial Economics

Dynamics of the Relationship Between Financial Inclusion and Tax Revenue: A Wavelet-Based Multiscale Quantile-on-Quantile Analysis

Pages 185-230

https://doi.org/10.22054/ijer.2026.89259.1443

Ali Moridian, Fatemeh Havas Beigi

Abstract This study examined the impact of financial inclusion on tax revenue in Iran over the period 1980–2022 using the novel wavelet quantile-on-quantile regression (WQQR) approach. This advanced methodology allows the relationship between variables to be analyzed across different quantiles and multiple time horizons, including the short, medium, and long run. Tax revenue was treated as the dependent variable, while financial inclusion, inflation, trade openness, real GDP per capita, and urbanization were considered as explanatory variables. Preliminary analyses, including the Brock–Dechert–Scheinkman (BDS) test and quantile–quantile (Q–Q) plots, revealed significant nonlinear dynamics and asymmetric distributions in the time series, thereby supporting the use of wavelet-based quantile methods. The empirical results showed that the effect of financial inclusion on tax revenue is heterogeneous across time horizons. In the short run, its impact is modest and varies with the level of financial inclusion. In the medium run, expanded access to financial services and enhanced informational transparency generate a significant positive effect. In the long run, financial inclusion exerts a consistently positive and sustainable influence on tax revenue. The effects of the control variables also vary across time horizons and distributional conditions. Inflation has a negative impact on tax revenue in the short run, although this effect gradually diminishes over longer horizons. Trade openness generally contributes positively to tax revenue, while economic growth strengthens tax revenue across all time scales. Urbanization also plays a positive role by broadening the tax base over the long run. Overall, the findings suggest that promoting financial inclusion, alongside institutional reforms and the digitalization of the tax system, can serve as an effective policy instrument for enhancing the sustainability of tax revenues in Iran. Introduction Financial inclusion has emerged as a key policy instrument for strengthening fiscal capacity and promoting sustainable economic development. By facilitating access to formal financial services, it increases the transparency of economic transactions, reduces the size of the informal economy, improves tax compliance, and broadens the tax base. Consequently, governments can mobilize more stable domestic revenues and reduce dependence on volatile sources of public finance. Although a substantial body of international evidence documents a positive association between financial inclusion and tax revenue, empirical findings also indicate that this relationship is nonlinear and varies across different levels of financial development and macroeconomic conditions. In Iran, where public finances have historically depended on oil revenues and have been constrained by economic sanctions, persistent inflation, tax evasion, and a large informal sector, strengthening tax revenue has become a critical policy objective. Despite significant expansion in banking infrastructure and digital financial services in recent years, there is limited empirical evidence on whether improvements in financial inclusion have translated into higher tax revenues. To address this gap, the present study aimed to examine the impact of financial inclusion on tax revenue in Iran over the period 1980–2022, while controlling for inflation, trade openness, GDP per capita, and urbanization. Unlike previous studies that mainly rely on conventional linear econometric models, the current analysis sought to apply advanced second-generation nonlinear techniques capable of capturing heterogeneous relationships across different quantiles and time horizons, thereby providing a more comprehensive understanding of the relationship between financial inclusion and tax revenue. Materials and Methods The present study used annual data for Iran spanning the period 1980–2022. Tax revenue served as the dependent variable, while financial inclusion was considered as the primary explanatory variable. Inflation, trade openness, GDP per capita, and urbanization were incorporated as control variables. Tax revenue data was obtained from the Central Bank of Iran, and macroeconomic indicators were sourced from the World Bank. Moreover, the financial inclusion index was taken from the International Monetary Fund, in which financial inclusion is measured by access to financial institutions, proxied by indicators such as the number of bank branches and automated teller machines (ATMs) per 100,000 adults. All variables were transformed into natural logarithms and converted from annual to quarterly frequency using quadratic interpolation to facilitate wavelet decomposition. Preliminary analyses included descriptive statistics, quantile–quantile (Q–Q) plots, the Brock–Dechert–Scheinkman (BDS) test for nonlinear dependence, and the wavelet quantile augmented Dickey–Fuller (WQADF) unit root test. The main empirical analysis was conducted using the wavelet quantile-on-quantile regression (WQQR) approach, which helped examine heterogeneous relationships across short-, medium-, and long-term horizons. In addition, the quantile-on-quantile Granger causality (QQGC) approach was used to investigate nonlinear causal interactions among the variables. Results and Discussion The preliminary analyses revealed significant non-normality and nonlinear dependence across all variables, indicating that conventional linear estimation techniques are insufficient to capture the complex dynamics of Iran’s economy. The WQADF test further showed that the stationarity properties of the variables varied across quantiles and time scales, thereby supporting the use of wavelet-based nonlinear methods. The WQQR results indicated that financial inclusion exerted heterogeneous effects on tax revenue across different economic conditions and time horizons. In the short run, the positive impact is strongest at the upper quantiles of both financial inclusion and tax revenue, suggesting that improvements in financial accessibility enhance fiscal performance primarily under relatively favorable economic conditions. In contrast, the effects were found weak or even negative at the lower quantiles, where limited financial access and the prevalence of informal economic activities constrain tax collection. In the medium term, the positive relationship becomes more stable as broader participation in the formal financial system enhances transaction transparency and improves tax administration. Over the long run, financial inclusion significantly strengthens tax revenue by expanding the formal economy, increasing the adoption of digital financial services, improving taxpayer identification, and reducing tax evasion. The results further showed that inflation exerted a negative effect on tax revenue in the short run, as rising prices would erode the real value of taxable income; however, this adverse impact gradually diminishes as fiscal policies and tax systems adjust over time. Trade openness contributes positively to tax revenue by stimulating economic activity and broadening the tax base, although these gains are partially offset by external sanctions and exchange-rate volatility. Likewise, higher GDP per capita consistently enhances tax revenue through increased production, employment, and corporate profitability, while urbanization promotes revenue mobilization by concentrating economic activity and expanding taxable consumption. Overall, as the findings demonstrated, the determinants of tax revenue operate through nonlinear and asymmetric mechanisms that vary considerably across quantiles and time horizons, underscoring the advantages of wavelet-based quantile techniques over conventional econometric approaches in capturing these complex relationships. Conclusion Financial inclusion is a key determinant of tax revenue in Iran; however, its effectiveness varies across economic conditions and time horizons. The positive impact of financial inclusion becomes substantially stronger over the medium and long term as financial transactions become more transparent and the formal financial system expands. Nevertheless, structural challenges—including persistent inflation, dependence on oil revenues, external sanctions, weaknesses in tax administration, and the prevalence of informal economic activities—continue to constrain fiscal performance. Consequently, expanding financial access alone is insufficient to achieve sustainable growth in tax revenue. Policymakers should therefore complement financial inclusion policies with comprehensive tax reforms, including the digitalization of tax administration, the adoption of electronic invoicing, the integration of financial information systems, stronger coordination between financial institutions and tax authorities, and policies that encourage the formalization of economic activities. These reforms would help broaden the non-oil tax base, reduce tax evasion, enhance fiscal sustainability, and support long-term economic development. Furthermore, the study highlighted the value of advanced nonlinear econometric techniques, particularly the WQQR framework, in capturing heterogeneous relationships that remain undetected by conventional linear models, thereby providing more robust evidence to inform fiscal policy formulation.

Research Paper Economic Development

The Impact of Industrial Structure on Green Economic Efficiency in the Provinces of Iran: A Spatial Tobit Approach

Pages 231-259

https://doi.org/10.22054/ijer.2026.87313.1385

Fariba Rashno, Maryam Sharifnezhad, Gholamali Haji

Abstract The balance between economic development and environmental sustainability is a fundamental determinant of sustainable development. Moreover, the optimal industrial structure is a key factor influencing both economic growth and the transition to a green economy. In this respect, the present study examined the impact of industrial structure on green economic efficiency. It applied a spatial Tobit approach to analyze the provincial data from Iran over the period 2011–2020. The results of the data envelopment analysis (DEA) indicated that Kohgiluyeh and Boyer-Ahmad and Isfahan provinces—with green efficiency scores of 1.00 and 0.60, respectively—had the highest and lowest levels of green economic efficiency. Furthermore, the Ellison–Glaeser index revealed that Qom and Qazvin provinces had the highest levels of industrial diversification, whereas Bushehr province exhibited the greatest degree of industrial concentration. Finally, the results of model estimation based on the spatial Tobit approach showed that both industrialization and industrial concentration had negative effects on green economic efficiency. However, the interaction between industrialization and industrial concentration had a positive and statistically significant effect on green economic efficiency. These findings suggest that increasing the share of industry in the economy while promoting industrial concentration based on each province’s comparative advantages should be considered key policy priorities to enhance green economic efficiency. Introduction The industrial sector plays a vital role in Iran’s economic development while also being a major source of energy consumption and environmental pollution. This dual role highlights the challenge of sustaining economic growth without exacerbating environmental degradation. Consequently, reducing the environmental impacts of industrial activity without compromising economic growth requires reforms in both the technological structure of industry and the optimal spatial allocation of industrial activities. It is thus necessary to examine how these factors influence green economic efficiency in order to design policies that support both economic development and environmental sustainability. The present study aimed to examine the impact of industrial structure and the geographical distribution of the industrial sector on green economic efficiency in the provinces of Iran during 2011–2020. The analysis focused on how industrial geography and structure could contribute to improving green economic efficiency. Given the importance of regional interdependence and spatial spillover effects among provinces, the study employed provincial data and spatial econometric models to examine the role of the industrial sector in simultaneously promoting economic growth and improving environmental quality. Materials and Methods The current study required the measurment of both industrial structure and green economic efficiency. It used the Ellison–Glaeser index to measure industrial structure. A key advantage of this index is that it accounts for both natural advantages and spillovers when measuring industrial concentration. The index ranges from −1 to 1, where negative values indicate the spatial dispersion of industrial production across regions, and positive values indicate industrial concentration. The second step involved measuring green economic efficiency. Two widely used approaches for efficiency measurement are stochastic frontier analysis (SFA) and data envelopment analysis (DEA). Compared with SFA, DEA offers the advantage of not requiring the model specification; moreover, it is based on linear programming techniques. In contrast, SFA relies on a predefined functional relationship between inputs and outputs. Given its advantages, DEA was adopted in this study to estimate green economic efficiency. Once industrial structure and green economic efficiency was measured, the relationship between them could be empirically examined. The data was obtained from regional statistics, statistical yearbooks, and reports on industrial establishments with ten or more employees published by the Statistical Center of Iran. Moreover, the study employed a spatial Tobit model to estimate the determinants of green economic efficiency. The Tobit specification is appropriate because the dependent variable (i.e., green economic efficiency) is a bounded continuous variable, with efficiency scores constrained to lie between 0 and 1. Results and Discussion The results indicated that economic growth had a positive and statistically significant direct effect on green economic efficiency, suggesting that production growth exceeded the rate of carbon dioxide emissions. However, the indirect spatial effect was found to be statistically insignificant, implying that economic growth in neighboring provinces does not generate spillover effects on green economic efficiency. This result reflects the heterogeneity of production processes across provinces and the limited transfer of technology among provinces Urbanization exhibited neither significant direct nor indirect effects on green economic efficiency. This finding suggests that the potential advantages of urbanization, such as labor specialization and skill diversity, are offset by its associated disadvantages, including traffic congestion and environmental pollution. The absence of a significant relationship may also reflect the mismatch between labor market skills and employment opportunities, as well as the failure to fully exploit economies of scale in urban transportation systems. Industrial concentration, measured by the Ellison–Glaeser index, had negative and statistically significant direct and indirect effects on green economic efficiency. This finding indicates that industrial concentration alone reduces green economic efficiency, largely because industrial agglomeration in Iran has not been accompanied by strong inter-industry linkages or efficient interprovincial supply chains. As a result, industries remain structured as siloed or fragmented. Similarly, industrialization, measured by the share of industry in GDP, exerted negative direct and indirect effects on green economic efficiency. This result suggests that expanding the industrial sector without technological upgrading or environmental improvements reduces green economic efficiency. Financial development did not have a statistically significant direct or indirect effect on green economic efficiency. This suggests that the financial system has not effectively supported the adoption of cleaner technologies or environmentally sustainable investments. International sanctions, exchange rate volatility, persistent inflation, and the relatively high returns available in non-productive markets have likely diverted financial resources away from green investments and modern technologies. As supported by the findings above, although industrialization and industrial concentration individually reduce green economic efficiency, their interaction has a positive and statistically significant effect, both within provinces and through spatial spillovers to neighboring provinces. In other words, industrial development can enhance green economic efficiency when it is accompanied by the geographical concentration of industrial activities. Such a combination promotes economies of scale, intensifies competitive pressures to improve energy efficiency, encourages greater investment in research and development, and facilitates technological upgrading. These findings imply that industrial policy should prioritize the geographically concentrated development of industries based on the comparative advantages of individual provinces. Conclusion According to the results of model estimation, Iran’s current industrial structure is fragmented. Nevertheless, the findings showed that the combination of industrialization and industrial concentration would be a key driver of improvements in green economic efficiency. When considered separately, both industrial concentration and an increase in the industrial share of output reduce green economic efficiency. However, industrial concentration mitigates the adverse effects of industrialization, and their interaction has a positive effect on green economic efficiency. Industrial concentration enhances green economic efficiency only when industrialization reaches a scale that generates economies of scale in research and development and accelerates technological progress. Accordingly, expanding the industrial sector while promoting industrial concentration based on provincial comparative advantages is a key policy for improving green economic efficiency. In addition, using economies of scale in public transportation as cities expand and directing financial resources toward technology-oriented investments are essential policy measures for achieving green economic efficiency.


Research Paper Growth Economy

Analyzing the Dimensions and Causal Relationships of Economic Warfare: An Application of the Fuzzy DEMATEL Method

Pages 260-301

https://doi.org/10.22054/ijer.2026.89908.1424

Siamak Tahmasebi

Abstract Economic warfare has increasingly replaced traditional forms of conflict as the primary means of exercising power in the contemporary international system. In this regard, the present study aimed to identify the key dimensions of economic warfare and examine the causal relationships among them. The research adopted an applied, exploratory approach using a mixed methods research design. In the qualitative phase, a systematic literature review was used to identify and conceptualize 13 dimensions of economic warfare. In the quantitative phase, expert opinions were collected, and the fuzzy DEMATEL technique was employed to construct and analyze the matrix of interrelationships among these dimensions. According to the findings, out of 13 dimensions, six dimensions (i.e., media–economic warfare, corridor warfare, cyber–economic warfare, currency warfare, financial warfare, and trade warfare) function as causal and enabling factors, serving as the primary drivers of the system. In contrast, the remaining seven dimensions (i.e., investment warfare, corporate warfare, technology warfare, resource warfare, energy warfare, food security warfare, and capital market warfare) were identified as effects and dependent factors, as they are primarily influenced by the causal dimensions. The main contribution of this study lies in developing a comprehensive 13-dimensional causal model of economic warfare that enhances understanding of the internal dynamics of this complex phenomenon. The proposed model provides a valuable framework for formulating effective countermeasures against economic warfare, particularly for the Islamic Republic of Iran. Introduction In recent decades, competition among states has increasingly shifted from direct military confrontation to the use of economic, financial, technological, and informational instruments. Within this context, economic warfare has emerged as one of the most significant means of exercising power in the international system. Governments seek to undermine the economic strength and constrain the decision-making capacity of target states through a range of measures, including financial and trade sanctions, technological restrictions, pressure on foreign exchange and capital markets, disruptions to supply chains, media and cyber warfare, and control over strategic resources and transportation corridors. From this perspective, economic warfare is not merely a collection of isolated actions; rather, it represents a complex network of interactions among economic, political, and security dimensions, whose effects simultaneously shape the performance of the national economy. Given the experience of the Islamic Republic of Iran in confronting extensive sanctions and other forms of economic pressure, understanding the internal mechanisms of economic warfare and the interrelationships among its various dimensions has become essential for effective economic policymaking. Despite the growing body of research in this field, most existing studies have examined individual dimensions of economic warfare in isolation, while relatively few have adopted a comprehensive approach that analyzes its multiple dimensions within a unified analytical framework. Accordingly, the present study aimed to identify the key dimensions of economic warfare and examine the relationships among them. In addition to advancing the theoretical literature on economic warfare, the findings of this study can provide a valuable foundation for policy prioritization, strengthening economic resilience, and improving strategic decision-making in the face of economic threats. Materials and Methods This study adopted a descriptive–analytical methodology and a mixed methods research design. In the first phase, the key dimensions of economic warfare were identified through a systematic review of the literature and policy documents, which served as the basis for developing the study’s conceptual framework. The second phase involved the analysis of relationships among the dimensions. A purposive sampling method was used to select experts with relevant academic qualifications, professional experience, and specialized knowledge of economic warfare. Consistent with expert-based decision-making techniques, such as decision-making trial and evaluation laboratory (DEMATEL), the validity of the analysis depends primarily on the expertise and competence of the selected experts rather than on the sample size. The fuzzy DEMATEL method was used to analyze the causal relationships among the identified dimensions. This method was chosen because of its ability to model complex interrelationships while accounting for the uncertainty inherent in expert judgments. The data was collected through a pairwise comparison questionnaire based on linguistic variables, which were subsequently converted into triangular fuzzy numbers. The direct-relation matrix and the total-relation matrix were then constructed. Following the defuzzification process, the indices of influence (D), dependence (R), prominence (D + R), and relation (D - R) were calculated for each dimension. Finally, the cause and effect groups were identified, and a causal relationship map of the dimensions of economic warfare was developed to facilitate the interpretation of the findings. Results and Discussion In the first stage, the systematic literature review led to the identification of thirteen principal dimensions of economic warfare: trade warfare, investment warfare, currency warfare, financial warfare, cyber–economic warfare, corporate warfare, technology warfare, resource warfare, energy warfare, food security warfare, corridor warfare, capital market warfare, and media–economic warfare. These dimensions constituted the final analytical framework of the study. The results obtained from the fuzzy DEMATEL analysis revealed that these dimensions are characterized by complex, dynamic, and interdependent relationships and, therefore, cannot be analyzed independently. The values of the influence (D), dependence (R), prominence (D + R), and relation (D - R) indices indicate that some dimensions function as driving forces, whereas others represent outcome dimensions within the overall structure of economic warfare. Accordingly, economic warfare can be conceptualized as a networked system in which changes in one dimension propagate through a network of causal relationships and influence the others. On the basis of the relation (D - R) index, media–economic warfare, corridor warfare, cyber–economic warfare, currency warfare, financial warfare, and trade warfare were identified as causes or driving factors, whereas investment warfare, corporate warfare, technology warfare, resource warfare, energy warfare, food security warfare, and capital market warfare were identified as effect factors. These findings suggest that policies aimed solely at mitigating the consequences of economic warfare are unlikely to be effective unless they also address its underlying driving factors. Among the driving factors, media–economic warfare exerted the greatest influence on the other dimensions, highlighting the critical role of public opinion management, the shaping of economic expectations, and cognitive operations in shaping financial markets, exchange rates, investment, and trade. Moreover, the identification of corridor warfare, currency warfare, and financial warfare as major causes underscores the strategic importance of transportation infrastructure, macroeconomic stability, and the financial system in reducing the vulnerability of the national economy. The prominence (D + R) index further indicated that investment warfare, currency warfare, corporate warfare, trade warfare, and financial warfare exhibit the highest levels of interaction with the other dimensions and therefore represent the central nodes of the economic warfare network. Overall, the findings demonstrate that effective responses to economic warfare require a systemic, coordinated, and driver-oriented approach that recognizes the economic, financial, trade, media, technological, and infrastructural dimensions as interdependent components of a unified network. Conclusion The present study employed the fuzzy DEMATEL method to identify the key dimensions of economic warfare and analyze the causal relationships among them. According to the findings, economic warfare exhibits an interconnected network structure in which its various dimensions influence one another through both direct and indirect relationships. More specifically, media–economic warfare, corridor warfare, cyber–economic warfare, currency warfare, financial warfare, and trade warfare were identified as the main driving factors, whereas the dimensions related to investment, corporate activities, technology, resources, energy, food security, and the capital market were classified as effect factors, reflecting their greater susceptibility to influences from other dimensions of the system. Strengthening economic resilience requires a strategic focus on the driving factors of the network and the adoption of an integrated policy approach. Therefore, enhancing coordination among monetary and exchange rate, financial, trade, technological, media, and infrastructure policies can play a critical role in reducing the vulnerability of the national economy to external pressures. Moreover, the prominent role of media–economic warfare underscores the importance of public opinion management, the shaping of economic expectations, and effective media governance as integral components of economic policymaking. The current study also contributes to the scholarly literature by proposing a causal model of the relationships among the dimensions of economic warfare and by providing a systematic framework for analyzing this phenomenon. Future research should adopt integrated methodological approaches to examine these relationships across different sectors and national contexts, thereby advancing the literature and informing the development of more effective policy recommendations for enhancing economic security and resilience.

Research Paper Economic Development

Fields of Influence of Technological Change in Input- Output Tables of Iran (1365- 1395)

Articles in Press, Accepted Manuscript, Available Online from 27 December 2023

https://doi.org/10.22054/ijer.2023.74222.1194

mohaddaseh soleimani, Aliasghar Banouei, Esfandiar Jahangard, teymor mohamadi

Abstract Innovation and technological changes spans various geographical locations over the time.The inability of Input-Output models in measuring the effects of technology changes, caused by new innovations, is known as a weakness of these models. In this article, we show how this weakness can be addressed by employing the fields of influence method. Technology changes are modeled as changes of one or more elements in the direct coefficients matrix and the impact of such changes in the Leontief matrix is measured. Here is the main question: Does the technology changes only impact a limited sector or the entire economical system? In other words, how would technology changes in one sector impact other sectors of economic system? The main goal in this paper is proposing a method which can measure how different sectors get impacted by changes at different levels such as one element, all elements, one row or one column and then evaluates the importance of different sectors. To this aim, Iran’s Input-Output tables over the period of 1365-1395 with the fixed price of Iran’s statistics center in 1390 is used. The impact of technology changes on each sector is measured using Leontief’s inverse matrix and the column field of influence approach (CFOI) approach. Our findings indicate that over this period of time, technological changes in the industry and then construction sectors have the most influence and the mining sector has the least influence on other sectors of Iran’s economy.

Research Paper Monetary economy

Macroeconomic Analysis of RamzRial: A DSGE Approach

Articles in Press, Accepted Manuscript, Available Online from 06 March 2024

https://doi.org/10.22054/ijer.2024.74533.1198

Hossein Esfandiar, teymoor mohammadi

Abstract Thanks to Blockchain technology the future of banking can take place without intermediaries (especially banks), and in this regard, Central Bank Digital Currency (CBDCs) and stablecoins of BigTechs are mentioned as the main competitors of the new monetary era. Based on this fact and in parallel with the efforts of most countries on the (theoretical and experimental) investigation of CBDC’s aspects, this article, using a dynamic stochastic general equilibrium (DSGE) model, in the period Q1 1388 to Q4 1400, economic effects of issuance of RamzRial (Iranian CBDC) was modeled and analyzed. In our model, RamzRial is an account-based, widely available to the general public, interest-bearing and cash complementary money, and the results of the implementation of quantitative and price rule policies were examined in the presence of RamzRial. The results of the model based on the data and calibration indicate that the issuance of RamzRial, while diversifying central bank tools, will improve the effectiveness of monetary policies in the event of (supply and demand) external shocks. One of the significant results, especially for the stagflation condition of Iran’s economy, says that through issuing (an appropriate amount of) RamzRial the central bank can implement disinflation programs while reducing its unwanted negative effects on production. Also, in addition to influencing the level of production, consumption, investment and employment, the results of our model prove that with the introduction of the RamzRial in parallel with cash balances, the most important factor affecting the transmission mechanisms is the dynamics of transaction cost deviations.

Research Paper Financial Economics

Estimating the Systemic Risk and Volatility Spillovers among Industries Listed Stock Market and Its Application in Optimal Portfolio; TVP-VAR Approach

Articles in Press, Accepted Manuscript, Available Online from 16 April 2024

https://doi.org/10.22054/ijer.2024.77367.1250

Reza Taleblou, Parisa Mohajeri, Abbas Shakeri, teymoor mohammadi, zahra zabihi

Abstract Achieving the correct insight into the structure of connectedness and the spillover of volatilities between different stock exchange industries plays an important role in risk management and forming an optimal stock portfolio. Also, the analysis of inter-sectoral connectedness helps policy makers in designing policies that stimulate economic growth and implementing preventive measures to curb the propagation of systemic risk. In this regard, this article tries to use the data of 3370 trading days during the period of 1388/07/01 to 1402/06/31, encompassing 20 stock market industries (which constitute more than 80% of the Iranian stock market) and applying the connectedness approach based on the vector autoregression model with time-varying parameters (TVP-VAR), to estimate the systemic risk and volatility connectedness of the stock market network. In addition, we implement the minimum connectedness approach in the optimal stock portfolio and compared its performance with two other conventional approaches. The findings reveal that, first; the systemic risk in Iranian stock market is significant and has reached unprecedented figures of 80% in the last three years. Second, the four major export industries (petrochemicals, metals, mining and refining) experience the strongest pairwise connectedness, and among them, base metals appear as one of the most important transmitters of volatilities to the entire stock network. Thirdly, the stock portfolio based on the minimum connectedness method, compared to the minimum variance and minimum correlation methods, shows a better performance based on the criteria of cumulative return and hedge ratio efficiency.

Research Paper Econometrics

Revising the Dynamics of Financial Assets Price Bubbles (A Case Study of Tehran Stock Exchange)

Articles in Press, Accepted Manuscript, Available Online from 11 September 2024

https://doi.org/10.22054/ijer.2024.78098.1263

Mohammad Feghhi Kashani, Teymor Mohammadi, zahra Aghighi

Abstract One of the key challenges in empirical studies relates to the identification of the dynamics of bubbles that periodically run up and collapse. This study is an attempt in this field, which initially examines some limitations of one of the relatively new methods in the economic literature as to the identification of rational bubbles in the Tehran Stock Exchange for the period of 2009-2020. Then, by assuming the Markov switching regime approach in this area, we have extended the conventional method by taking into account the dynamic interaction of asset prices in the market with the latent factor in the process of bubbles expansion and collapse. It is shown how this framework, while improving the efficiency of detecting financial bubbles through mitigating the specification error of dynamic models compared to existing alternative methods, is capable of incorporating the feature of traders' interactions in the market with no specific assumptions on how they interact, especially with regard to the coordination of their expectations and pursuant trading behavior. The findings resulting from this method indicate the existence of a bubble in asset prices only for the period 2018-2020, as opposed to the use of the conventional method, which implies either no bubble or the existence of two bubbly periods 2012-2014 and 2018-2020. in the Tehran Stock Exchange.

Research Paper Employment

The relationship between poverty and young people not involved in education, skill training and employment in Iran

Articles in Press, Accepted Manuscript, Available Online from 27 August 2024

https://doi.org/10.22054/ijer.2024.78275.1265

Shima Namazi Zavareh, Farshad Momeni, Ali Asghar Salem

Abstract In order to face the challenge of youth poverty, the main focus should be on facilitating the access of the NEET population to quality education and decent job opportunities. Considering that this group of people is a potential threat to the country's achievement of one of the most important goals of sustainable development, i.e. ending poverty through decent work and economic growth, and they turn the young population into a challenge and not an opportunity in the economy, Examining the impact they have on poverty and the impact they receive from poverty is very important. In this regard, the aim of this article is to investigate the simultaneous relationship between household poverty and population phenomenon in the urban and rural society of Iran in 1401. For this purpose, using the detailed data of urban and rural households' expenditure and income plan, the poverty line was first calculated based on the multidimensional poverty approach and poor households were identified. Then, the households that have demographic phenomena were also identified. The results of the estimation of the research model using the two-stage least squares method (2SLS) showed that in urban areas, population phenomenon and poverty both have a positive and significant effect on each other. Unlike in urban areas, the results of the estimation of the research model in rural areas indicated that the population phenomenon does not have a significant effect on household poverty, but on the other hand, household poverty has a positive and significant effect on it.

Research Paper Employment

Investigating the Effect of Poverty on Informal Employment in Iran Using the Two-Stage Heckman Probit Method

Articles in Press, Accepted Manuscript, Available Online from 27 August 2024

https://doi.org/10.22054/ijer.2024.78386.1268

Shima Namazi Zavareh, Farshad Momeni, Ali Asghar Salem

Abstract A major reason for pushing people towards informal jobs is the motivation of necessity. In fact, informal employment is a kind of survival strategy for those who have no other way to earn money and support themselves and their families except by working in these types of low-paid jobs. At the level of development, the continuation of this trend affects the economic competitiveness and the quality of life of the citizens, and the foundation of national production and technological and innovative production faces serious limitations. the purpose of this article is to investigate the effect of household poverty along with other socio-economic factors on informal employment in urban areas of Iran in 2019. For this purpose, by using the detailed data of the expenditure and income plan of urban households, first, the poverty line was calculated based on the absolute poverty approach for urban areas and poor households were identified. Then according to the index presented in this research, the type of employment of households was determined in terms of formal and informal. The results of estimating the research model using the two-stage Heckman Probit method indicate that household poverty leads to a significant increase in informal employment, so that with an increase in poverty, the probability of being informally employed increases by 0.57. The strategic message of this study is that the problem of poverty and informal employment in Iran can be overcome only by upgrading the technological production base and creating value-creating capabilities based on increasing productivity.

Research Paper Monetary economy

Endogenous or exogenous money? Evaluating the endogeneity of money supply in Iran by the post-Keynesian approach and the state-space method based on control function

Articles in Press, Accepted Manuscript, Available Online from 10 November 2024

https://doi.org/10.22054/ijer.2024.79815.1280

zahra bigdeli shamloo, Abbas Shakeri, Teymur Mohamadi, Syrous Omidvar

Abstract The main purpose of this study is to analyze the nature of the money creation process by examining the approaches related to this process in Iran. The two main views regarding the money creation process are the endogenous and exogenous money approaches. The endogeneity of money means that the money supply is directly influenced by the economic activities and conditions in the economy, and it is not determined by central bank exclusively. The endogeneity of money can also be a very important factor in the efficiency and effectiveness of monetary policies on macroeconomic indicators. Therefore, in order to test the endogeneity based on post-Keynesian approaches, the two-stage method of the state-space approach was applied to determine a time-variable model of money supply using the annual data from 1357 to 1400 in Iran. The results indicate: firstly, money is endogenous. Secondly,the effect of explanatory variables on it is not constant over time, and therefore, it is necessary to change monetary policies from targeting on money aggregates according to the conditions of endogenous money.

Research Paper Public sector economics

The Impact of Globalization on the Iranian Underground Economy Over Four Decades: MIMIC and ARDL Approaches

Articles in Press, Accepted Manuscript, Available Online from 13 July 2025

https://doi.org/10.22054/ijer.2025.82326.1314

Ahmadreza Ahmadi, Ghahreman Abdoli, Fatemeh Azhari

Abstract The present study examines the impact of globalization on Iran’s underground economy over the period 1979–2020. In this regard, the size of the underground economy was estimated using the MIMIC method. Subsequently, the effects of the three main dimensions of globalization—economic, social, and political—as well as the dual components of each dimension (de facto and de jure), were analyzed using the autoregressive distributed lag (ARDL) approach. The findings from the long-run estimations indicate that the economic and social dimensions of globalization have a negative effect on the underground economy, whereas the political dimension exerts a positive effect. Further analysis of the components of each globalization dimension reveals that both the de facto and de jure components of social globalization negatively influence the underground economy. Although the de jure component of economic globalization also has a negative impact, its de facto component does not have a significant effect. Regarding the political dimension, de facto component has a significant positive effect on the underground economy, while the de jure component does not show a meaningful impact. Additionally, the results demonstrate that, in all four estimated models, unemployment has a positive effect and financial deepening has a negative effect on the underground economy. These findings offer useful guidance for policymakers aiming to reduce the size of the underground economy and enhance economic transparency in the country.

Research Paper urban economy

A Bibliometric Analysis of Indicators for a Circular Green Economy in Smart City Management

Articles in Press, Accepted Manuscript, Available Online from 15 July 2026

https://doi.org/10.22054/ijer.2026.88572.1405

simayeh najar ghabel, davood Behboudi, Parviz Mohamadzadeh

Abstract Climate change and limited natural resources pose significant challenges to urban sustainability. In response, the circular green economy has emerged as a novel approach to urban management, aiming to reduce resource consumption, waste generation, enhance efficiency, and improve citizens' quality of life. Given the scarcity of scientific data and information in this area, this research employed a bibliometric study to investigate the indicators of the circular green economy in smart city management. This developmental research adopted a meta-synthesis approach, utilizing a document-bibliometric method. By applying meta-synthesis to 28 selected articles, a total of 44 components were identified and labeled under 8 indicators. The credibility of the reviewed articles was assessed using the CASP tool, while objectivity was measured using inter-coder agreement with the Scott's pi test, both of which yielded satisfactory results. The validity of the identified indicators was further evaluated using the Lawshe method. As a result, four components with scores below 0.6 were excluded, leaving 40 validated components. Based on the findings, a framework with 40 indicators across eight dimensions was developed for the circular green economy in smart city management. These dimensions include digital urban metabolism, smart city design, smart recycling, green energy cycle, green entrepreneurship, smart circular governance, bricolage, and green smart technology. The results of this study provide a roadmap for creating sustainable and smart cities that consider all aspects of urban life, including environment, economy, and society.

The Impact of Economic Sanctions on Gross Domestic Product and Social Welfare for Iran: Generalized Stochastic Growth Model

Volume 20, Issue 63, Summer 2015, Pages 37-69

https://doi.org/10.22054/ijer.2015.4093

Hossein Marzban, Ali Hossein Ostadzad

Abstract Ongoing sanctions on Iranian economy have proved to be very harmful and detrimental to Iranian economic affairs and social welfare. Evaluating the unfair impacts of these sanctions on Gross Domestic Product (GDP) and social welfare is the aim of this paper. Firstly, we have developed a generalized growth model in the presence of sanctions while treating exchange rate as a random variable. Secondly, three different forms of sanctions are introduced into the model and their bearings on national product and social welfare is studied. The first tier of the sanctions is imposed on consumption, intermediary and capital goods while exchange rate is assumed to have a random behavior. Then sanctions are also imposed on Iranian oil and gas production. We have devised several scenarios using stochastic Hamilton Bellman Jacobian value function (SHBJ) and genetic algorithm optimization methods. Our results of the first and second scenario imply that the level of social welfare is mostly affected by oil and gas sanctions while goods embargo has targeted goods production. The effects of sanctions on GDP and social welfare is represented by a concave curve. This curvature shows that the impact of sanctions on GDP and social welfare is stronger at the beginning than later on when further sanctions are introduced. In the third scenario oil, gas and goods sanctions are imposed simultaneously. Our results also show that the third scenario effects is stronger than the other two. According to the Gross Domestic Product data acquired for year 1390, oil and gas sanctions have lowered the GDP by 30 percent, while the overall reduction in GDP through all sanction collectively is estimated between 30 to 50 Percent.

Estimating the Value of Derham and Dinar in Muslims' Economic History

Volume 6, Issue 21, Winter 2005, Pages 51-66

Mansour Zarra Nezhad

Abstract Before the appearance of Islam, Dinar and Derham were the currencies of Byzantine and Iran, recpectively. These two currencies were current in pre-Islamic Arabia and continued to be the currencies of primary Islamic states. In 74 (AH) Islamic Dinar and Derham were coined. Estimating the value of Dinar and Derham is a matter of considerable importance to those doing research in Islamic Economics. The present article tends to estimate the value of these two currencies using two methods of purchasing power and natural value. The findings from the research show that each Dinar worths 293 to 350 thousand rials. 

Analyzing the Effect of Exchange Rate Pass- Through on Inflation in Iran (1991-2012)

Volume 20, Issue 63, Summer 2015, Pages 1-36

https://doi.org/10.22054/ijer.2015.4089

Seyed Komail Tayebi, Khadijeh Nasrollahi, Mehdi Yazdani, Seyed Hassan Malekhosseini

Abstract The exchange rate pass-through explains the relationship between changes in national currency and foreign trade of a country, while the responsiveness of trade to the currency changes depends on the perfect or imperfect degree of pass-through. The objective of this study is to analyze the effect of exchange rate pass-through on inflation in Iran as one of the main oil-exporting countries. To this end, we have specified a Structural Vector Auto-Regressive (SVAR) model including macroeconomic variables such as oil revenues, output gap, free market exchange rate, import prices, producer prices, consumer prices and money supply. To estimate the model, we have used quarterly data over the period 1991:1 - 2012:4.      Empirical results of the model estimation, which are in forms of impulse response functions and variance decomposition, have shown that although the degree of exchange rate pass-through to the price indices has been incomplete, changes in the exchange rate have led to fluctuations in the prices explaining partly Iran’s inflationary situation during the period under consideration. It also reveals the fact that a higher share of imported inflation implies the economy’s dependence on imports.

COMPARISON OF COUNTRIES DEVELOPMENT

Volume 4, Issue 10, Spring 2002, Pages 67-103

Farrokh Masjedi

Abstract Comparison of countries development is one of the topics of interest to Economists, as well as international organizations. Human Development Index (HDI) has shown that there is possibility to use a unique, index to explain multilateral expanded phenomenon of development.
This essay surveys the HDI and its shortcomings and tries to develop a unique index for measuring countries development by using two techniques of Factor Analysis and Numeric Taxonomy. In this index about 90 variables are used to take into account various economic, social and political factors affecting economic development. Obviously, this method has many disadvantages, which should be discussed. The Index is applied to 100 countries.

Estimating the Parameters of Inter-industry Variability Function of Profit Margins and Evaluating the Degree of Concentration in the Iranian Manufacturing Industries Based on the U-Davies Approach

Volume 19, Issue 58, Spring 2014, Pages 39-76

Mohammad Nabi Shahiki Tash, Ali Norouzi

Abstract The objective of this paper is to estimate and analyze market power and degree of concentration in Iran's Manufacturing industries. The paper employs Inter-industry Variability function of profit margin approach and U-Davies in order to evaluate degree of industrial concentration. The finding indicates that elasticity of inequality distribution for market share in the industries is less than 0.5 and therefore it is understood that the market share of the industry is almost sensitive relative to the new entry firms. The results also demonstrate that the average value of the U-Davies concentration index for the manufacturing industries is 0.038, so that the manufacturing of tobacco products with 0.616 and manufacturing of plastic products along with manufacturing of other non-metallic mineral products have had the highest and lowest levels of concentration index respectively. 

A COMPARISON OF EFFICIENCY IN PRIVATE AND GOVERNMENT BANKS USING A PARAMETRIC MODEL

Volume 13, Issue 41, Winter 2010, Pages 1-28

Seyed Komail Tayebi, Mohammad Omidinezhad, Abbas Motahari Nejad

Abstract The purpose of this research is to measure cost and profit efficiency for the Iran's commercial and public banks. We also determine time variant efficiency factors for period 1381-1384 (2001-2004). To measure the efficiency, we use stochastic frontier analysis (SFA) and error component model following Battese and Coelli (1992) using the Maximum Likelihood method and a panel data. Labor, physical capital, and financial capital are considered as inputs, and loans, bonds and other earning assets as outputs. The results show that most of the private banks are more efficient in profit efficiency than public banks, while most of the public banks are more efficient than private banks in cost efficiency. The cost efficiency has decreased but the profit efficiency has increased for the period under consideration. Profit efficiency is not positively correlated with cost efficiency, suggesting the possibility that cost and revenue inefficiencies may be negatively correlated. Cost efficiency ranges from 46.88 percent (Bank Saderat) to 91.58 percent (Bank Tejarat) with an average of 68.8 percent, and profit efficiency from 61.16 percent (Bank Melli) to 94.85 percent (Bank Sepah) with an average of 85.3 percent. Average and variance of profit efficiency is more than those of cost efficiency, implying profit efficiency is influenced by more variables.

ANALYSIS OF STRUCTUREAL CHANGE IN THE IRANIAN ECONOMY

Volume 2, 4&5(Spring and Summer), Spring 2000, Pages 130-184

Ali Hassan Zadeh

Abstract This paper tries to analyse the structural changes of the Iranian economy during 1969-1988. For this purpose the Input - Output tables of 1969, 1974, 1984and 1988 have been used. The original tables were at current prices and therefore could not be used to quantify the structural changes of the Iranian economy in real term. For this purpose, after making sectoral comparisons, and taking the year 1974 as the base year, all the tables have been deflated by using the double deflation methods.

Keywords Cloud